DRAWING ROBOT:
PART IV
1. Introduction
In this final part, we'll put together our image processing algorithm and our drawing algorithm from part two to draw images on the whiteboard. Before we begin to draw, we'll have to perform some calculations in order to fit the image into our particular board and also scale it to a factor if we so desire. In the end, we'll add another functionality to let the user use a webcam to get snapshots, process, and draw them.
2. Resizing the image to our board
If you recall, when we performed the torque analysis, we defined a drawing area on our whiteboard. The coordinates that we get from the image processing are given in pixels. We have to convert that to physical units, in this case centimeters, and then scale it to fit in this area. In order to do this, we'll need a global scaling factor that we'll use to resize the original image.
We have a drawing range for both the image in pixels and the one that will be on the whiteboard. For the one in pixels, it's given by the difference between the minimum and maximum pixel in each direction:
yMinPixels
yMaxPixels
xMinPixels
xMaxPixels
yRangePixels
xRangePixels
Figure
0

In this case, the X and Y ranges vary from image to image. Regarding our whiteboard, the range is always fixed and given by the values established in part 2:

xMin
xRange
DRAWING AREA
yRange
xMax
yMin
yMax
0

It's obvious that to get a factor to convert from pixels to centimeters, we have to divide the image ranges by the board ranges. We'll then have an X-direction and a Y-direction factor:

But which one do we choose? The answer is the smallest one because it will fit the largest length in our drawing area. If we consider the two cases, when we have a tall image, and when we have a wide image, this becomes clear:
Tall image: small Y factor
Wide image: small X factor
As we've mentioned before, we'll also have the choice to scale the image on our drawing area. That is, don't use the whole area, but a fraction of it. To achieve this, all we have to do is multiply the resulting factor by another factor that goes from 0 (0%) to 1 (100%) that we'll call sFactor. Therefore the final factor is:
We can't yet multiply all the pixels coordinates by this factor in order to get the physical coordinates because this factor relates only the drawing areas, without taking into account where on the board we want to place the drawing. We want it to be centered in our defined whiteboard limits, and to achieve that, we'll have to perform some more calculations.
First, we find the center of our drawing area. It's clear that the coordinates will be given by the starting values plus half the range. In our code, the minimum and maximum values of each direction are stored in vectors called xLim and yLim:

yRange
yMin
0
xRange
2
xMin
2
With the center coordinates, we can proceed to find the origin of the drawing in physical coordinates. To scale the drawing from pixels to centimeters, we just have to multiply its range by the calculated factor. Then, to find it's center, we divide it by two:
yRangePixels factor
2
xRangePixels factor
2
From the diagram below it becomes clear that to find the origin of the drawing, we have to subtract the value that we just calculated from the center distances:
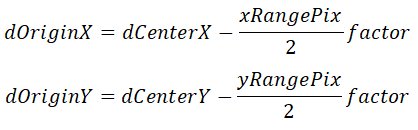
dCenterY
0
dCenterX
yRangePixels factor
2
xRangePixels factor
2
dOriginY
dOriginX
Now we have all that we need to transform the coordinates from pixels to centimeters. To do that, we subtract the initial values from the coordinates. This resets the origin in pixels. Then, to transform it to centimeters, we multiply it by the factor. Now we have the physical coordinates values. Finally, we add the origin values to get the final coordinates with the drawing centered inside our whiteboard limits and scaled to our desired factor (0 - 100%).

We created a function to perform these steps for us:
We've also created a live script to have a workflow. Let's see it and the results:

To begin we open the app, process the image that we want, and send the results (coordinates cell array and XY limits) to the workspace:

This is the plot of the pixels coordinates:
Then we run the function to convert it to centimeters:

Notice how the scale has changed from pixels to cm. If we zoom in and take a closer look at how far the pixels are, we'll see that they are really close to each other:

If we try to draw the segments as they are, the robot will take a very long time to do it, so it would be a good idea to increase the distance between them while maintaining the original image shap. That's what we'll do next.
3. Trimming the segments
We'll also create a function to perform this task. We'll choose a minimum distance (or radius) between each pixel and remove any that doesn't meet the criteria. Then we'll move to the next pixel until we've looped through all segments points:
original segment
step 2
initial
step 1
distance
points to be removed
step N
final
Here's our code:

We'll add a new section to the live script to do this and plot the results:

For this particular case, we choose a distance of 1 cm, which is a lot, in order to highlight the difference:

It's clear that now the distance between the points is much larger:

Finally, we plot how the drawing is going to look like on the whiteboard. The black rectangle represents the whiteboard, and the red one our drawing limits:

We've been calling a function on the live script to plot these results instead of writing all the code there. This keeps the script clear and intuitive. Here it is:

Let's also see how the chosen scaling factor fits the image into the limits:


sFactor = 0.4
sFactor = 0.8
sFactor = 1
4. Drawing processed images
After all these steps, we can finally proceed to draw the images on the board. We'll use a scaling factor of 0.5 (50% of the drawing area) and a 2mm space between each waypoint.
First, let's draw the mountain figure. We open the app, process the image, and export it to the working space:

We've created a live script with all the functions to convert the image to drawing segments and then draw it. Notice that in the second part the user can choose between processing an image that's on the computer, or using the webcam to take one. We'll explain this in the next section.


Here's the plot of the converted centimeters segments:

And the final result:
Next, let's draw a full vector image. We begin by opening the app and getting the processed image:

We then plot the physical units segments:

And the actual drawing:
The robot reproduces the images with good accuracy. The overall shape is maintained and we are able to scale it on the board however we want to.
5. Drawing images from a webcam
The last feature that we'll implement is an app that allows the user to capture an image using a webcam and process it the same way that we did before. This app is similar to the previous one, except that instead of getting an image from the computer, we take a webcam snapshot.
Let's see how it works. We've manually drawn a figure on the whiteboard that we want the robot to copy: the Arduino logo. We'll use the app to take a snap from the webcam and transform it to pixel coordinates:
Here's its code:

Using the same script that we did in the previous section, we transform it to centimeters coordinates and adapt it to our board with 0.5 factor (50%):

And then we draw it:
6. Conclusion
In this project, we learned many interesting things. We saw how to:
- Derive the equations of motion of a robot through the geometry of the system and use them to control it.
- Implement forward and inverse kinematics of a drawing robot.
- Create intuitive apps with buttons, knobs, and sliders to communicate with the hardware and control the robot wirelessly, drawing on the board.
- Calculate the necessary torque in every condition and draw a 3D and 2D torque map.
- Move the robot through a set of waypoints clicked by the user and processed to optimize the drawing.
- How images work in Matlab and how to process them using various morphological operations.
- Write various algorithms to transform image pixels coordinates to real-world physical coordinates and adapt them to be drawn in our particular whiteboard.
- Create a smart workflow using live scripts to put together everything that we've created and go from opening an image, processing it, communicating with the hardware, and drawing it.
- Create an app to use a live webcam to take snapshots, process, and draw them.
We could further develop both the robot capabilities as well as the image processing algorithm to improve the drawing quality or perform more complex tasks. Here are a few examples of ideas for further development:
- Improve the image processing algorithm to be able to process more complex images, such as objects and people's faces.
- Develop a better motor speed controller using Simulink. Besides generating a smoother and more accurate drawing from an image, this would further allow us to better draw on the whiteboard using the first section app. Due to the fact that the torque changes based on the robot's position and our app is based on a fixed voltage value chosen by the user, it's not really drawing straight in a chosen direction. A speed controller would fix this because it would increase the voltage until each motor reached the necessary speed to drive in a certain direction.
- Implement a code to make colored drawings using both markers.
- Improve our user drawing code to allow the user to draw freely with the mouse instead of clicking on desired waypoints.
Lastly, it's important to realize that this robot is not robust and therefore we can't expect it to produce very precise drawings. If we changed its structure to make it hold the marker in a steadier way and developed a smooth speed control algorithm in order to minimize its shaking, we would be able to draw much faster and the result would be a lot better. Nevertheless, we can learn a lot with this robot and the knowledge will serve us in many other projects.